
Overview
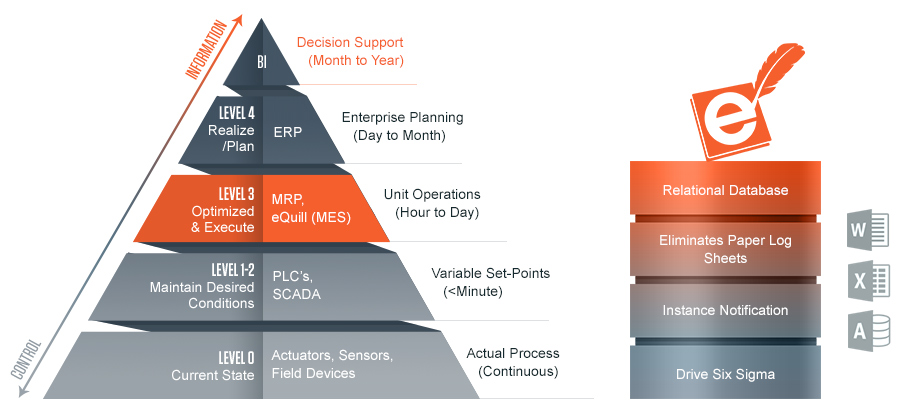
Much of the data managed within the business systems such as enterprise resource planning (ERP) originates from the plant floor. This includes data such as quality, raw material receipts, finished good receipts, shipments, and inventories. Without an interface to a plant-floor data acquisition system, this information typically must be keyed into the top-level systems.
This leaves room for errors and data inconsistencies and in addition, delays information getting to the people and systems that need it. Having this information available in the top-floor from the shop floor in a timely manner has great advantages. eQUILL (Electronic Quality Information and Logistics Logsheets) system is an effort to provide such an interface that enables the operator data
to be collected to a central database and allows various business systems for effective data collection and being updated with accurate data in real time.
Besides importance of the access of real-time data, plant history is a valuable corporate asset as well. Having a central database provides the ability to capture and store thousands of data points related to the process plant. By having this, it is easy to recreate a plant's history for future analysis. eQUILL generates data for end-users and software applications quickly and efficiently. It helps personnel to easily implement plant and corporate initiatives such as process improvement, Total Quality Control (TQC), and predictive maintenance by unifying plant data into a single repository where any individual in a company can view and analyze the same information.
Within a manufacturing facility, there are several methods currently being used to capture process and production data. In many areas, the data is captured on paper that inherently causes inefficiencies including:
- Information is difficult to locate.
- Conducting process, quality or production investigations is very time consuming.
- Reporting is static, not dynamic.
- Inefficient use of operator, foreman, engineering and coordinator time.
- Business, technical and production decisions may often be made based on inaccurate data.
In addition to the paper records, there are numerous applications used for capturing data including the Honeywell TDCs, GLIMS and other custom built applications.
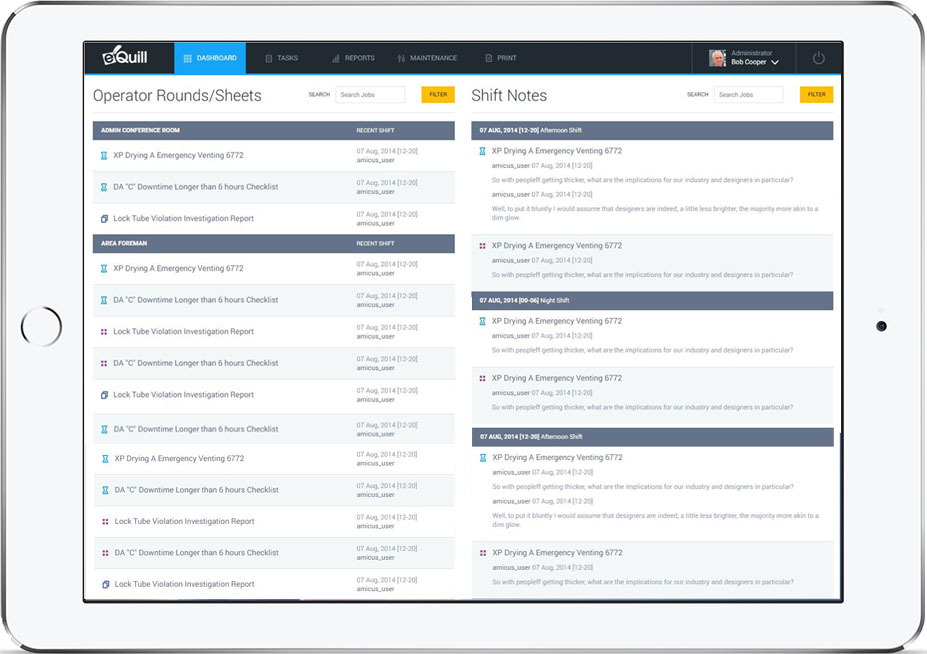
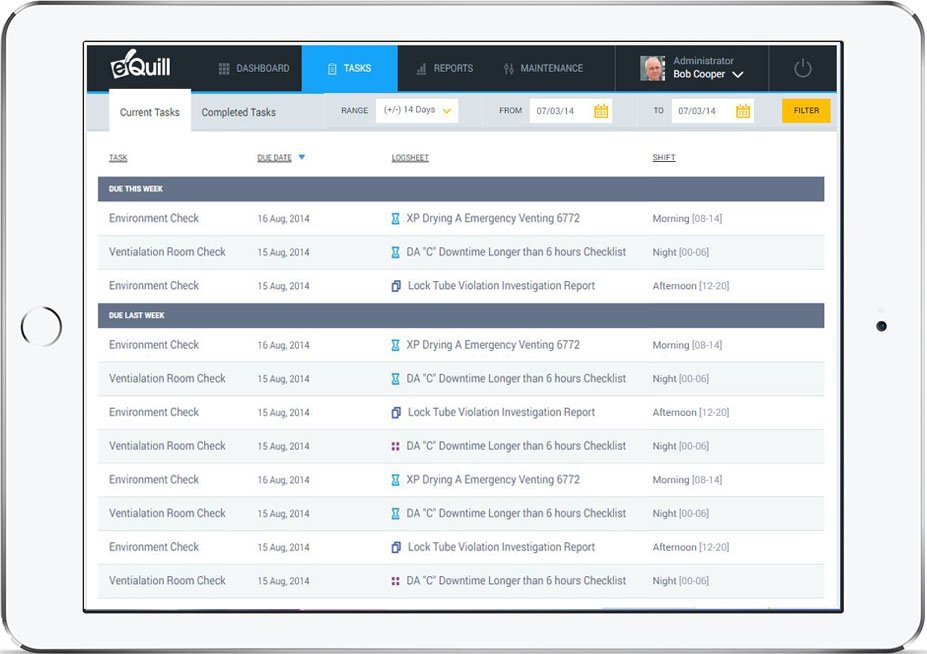
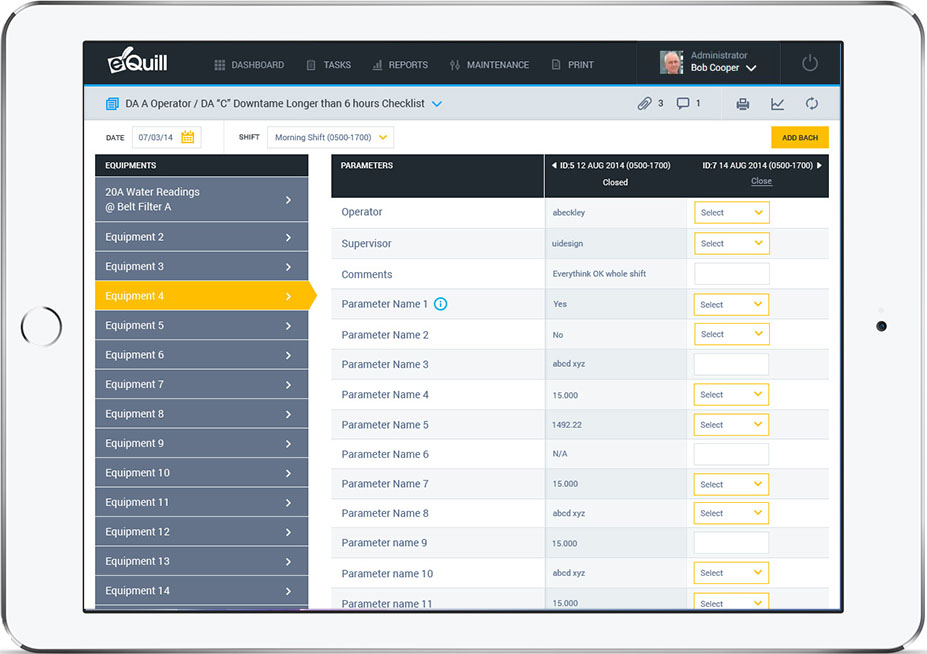
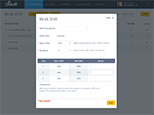
eQuill is designed so that the user can generate “customized” operator and foreman log sheets with each data point in the log sheets identified as to how and when it needs to be captured. It has proven to be a useful tool in assisting engineering, production and quality departments in the following ways:
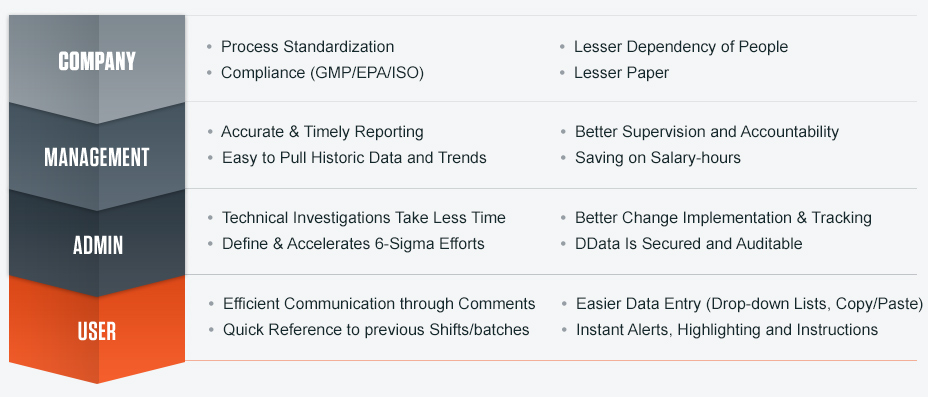
- More accurate, automatic reporting. Flexible and dynamic.
- Less time spend to gather shift and other standardized reports.
- Technical investigations take less time.
- Less salary man-hours spent on paperwork.
- Information can be queried.
- Easy browsing for viewing historical data.
- Assures accurate auditing.
- Assures accurate auditing.
- Data is now quantifiable information resulting in knowledge based management.
- Enabled numerous 6 sigma efforts to be accelerated.
- Defining 6 sigma projects.
- Manages operations over a Web browser.
- Secure data backup operations.
Key Features List
CFR Part 11 Compliant (audit trail, electronic signature, implementation plan, document control).
Built-in shift handover and daily foremen report including production, downtime, utilities usage etc.
Integrated with SharePoint (document management systems).
Scheduling tasks and field rounds with compliance report through calendar view.
Live trending and SQC charts (moving range, 3-sigma).
Integrated with SAP, Honeywell PHD and LIMS system.
Download
Detailed Features list Download
Benefits
Industry Applications
SQC Chart for Time based Logsheet
- Real time plotting for Trend, 3 Sigma and Moving Range charts for parameter values entered in Logsheets
- The Trend chart for all the numeric parameters of the Logsheet is created by default
- Option to change the parameter value or chart type, on each chart
- Ability to add new parameters from across the Logsheets, to create charts
Logsheet Status Calendar
- Provides the ability for checking the Logsheet status, in a Calendar view
- Monthly and weekly Calendar view
- Logsheet names are color coded as per the status
- Logsheet names are link for navigating to that particular Logsheet with “Back to Calendar” link on the Logsheet
Display Filter
- Provides the ability to select how many columns the user wants to see in the Logsheet, while entering data
- User can select no. of hours to be displayed in Time based logsheet and no. of batches in Batch based logsheet
Raw Material Variance Report
- to check the variance between standard usage and cost Vs actual usage and cost of raw materials, while manufacturing a lot
- Minute by minute data is pulled from Honeywell and averaged out for an hour to get more accurate results
- Creates automatic Raw material logsheet and inserts hourly data of Honeywell
- Ability to upload Bill of Material sheets to get updated cost for calculations
Overwrite Comment
- A compliance feature to track parameter values which are overwritten.
- Option to track overwrite during the shift also or only after the shift.
Overwrite Report
- Report to get all the parameters with overwritten value for audit purpose
Notification Email
- Notification to user group based on the status of logsheet such as“Logsheet Not Closed”, “Parameter Exception”, “Logsheet Exception” and “Logsheet Comments”
- Ability to define the user group to receive notification and keep it on or off, as required


Get Started:
- Contact Us: +91 (771) 401-3102
- Email Us: info@amicusglobal.com
- Request a Call From Us
- Download Our Corporate Profile


